Reading the graph
The console collapses the task graph into project nodes. A project node can therefore represent several targets: select the node to see those targets and their individual cache results in Node Details.
The example below is generated from Terrabuild's own source tree. Selecting the named terrabuild project highlights the node and every dependency edge connected directly to it.
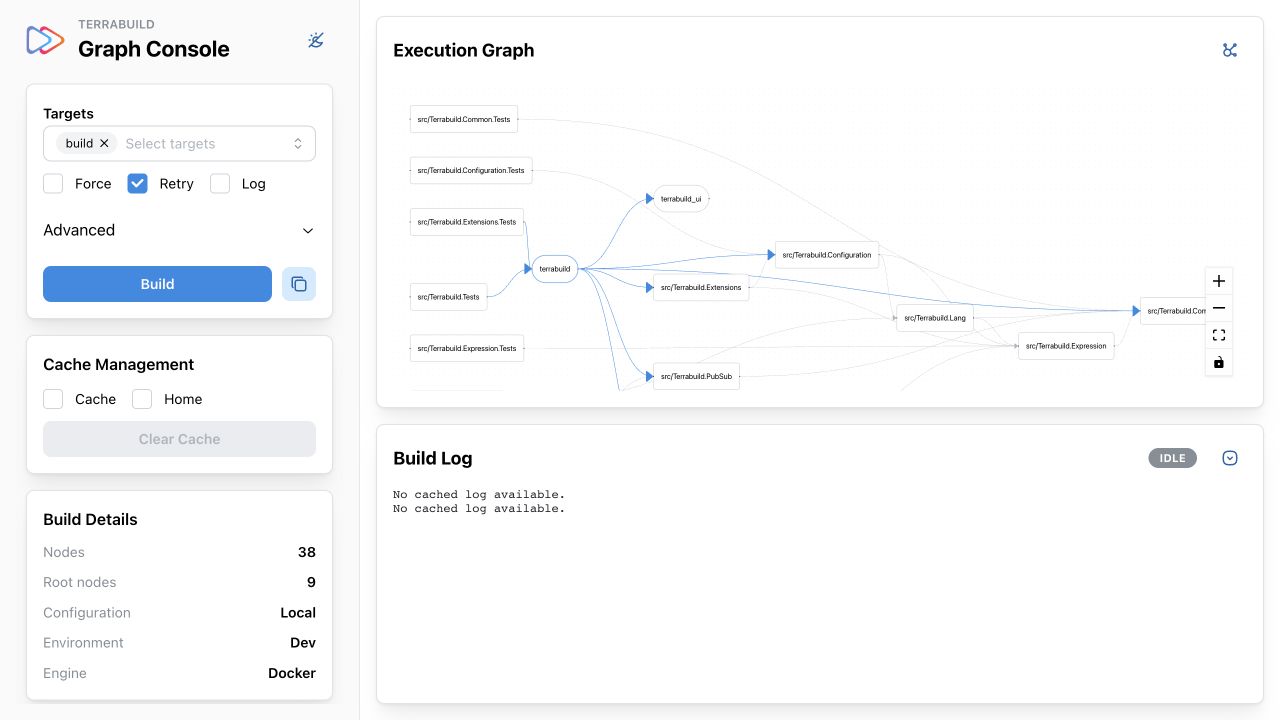
Node labels and shapes
The node shape tells you how the project is identified in its PROJECT file:
| Shape | Meaning | Label |
|---|---|---|
| Rounded pill | Named project | The explicit project name |
| Rounded rectangle | Anonymous project | The project directory relative to the workspace |
For example, Terrabuild's UI declares an explicit name:
project terrabuild_ui {
    @pnpm { }
}
It appears as the pill-shaped terrabuild_ui node. Most of Terrabuild's libraries are anonymous:
project {
    @dotnet { }
}
That project appears as the rectangular src/Terrabuild.Common node. Shape describes project identity only; it does not indicate success, importance, or whether a node is a graph root.
Node colors
The background color summarizes cached results for the targets represented by that project in the current graph:
| Appearance | Meaning |
|---|---|
| Green background | Cached summaries are successful. |
| Red background | At least one cached summary failed. |
| White background | No cached summary is available. In dark mode this uses the normal dark node background. |
| Blue border and glow | The node is selected. |
Statuses are specific to the current graph inputs and cache keys, including targets, project hashes, configuration, environment, and engine. A white node is unknown/not cached, not a failure. If only some targets have cached summaries, the color summarizes the summaries that are available.
Dependency arrows
An edge connects a project to a direct dependency. The arrowhead points toward the dependency. In other words, following an arrow takes you from the project that needs work to the prerequisite project it needs.
Selecting or dragging a node turns its directly connected edges blue and makes them thicker. Other edges stay gray. This highlight is only an inspection aid; it does not change the graph or build order.
Terrabuild's own named application project demonstrates a project dependency:
project terrabuild {
    labels = [ "app", "dotnet" ]
    depends_on = [ project.terrabuild_ui ]
    @dotnet { }
}
The console therefore draws an arrow from terrabuild toward terrabuild_ui.
Phases
Enable Advanced → Phases to show workspace phases. Projects in the same phase are placed inside a pale-blue group with a dashed blue border. Dashed blue arrows connect phase groups and point toward the prerequisite phase.
Phase grouping is disabled by default because it increases the size of large graphs. It changes only the visualization: phase dependencies already participate in graph construction and execution ordering. See Phases for configuration details.
Navigate the graph
- Select a node to inspect its project targets and cache results.
- Drag a node to adjust the layout temporarily.
- Use + and − to zoom.
- Use the fit-view control to bring the complete graph back into view.
- Use the lock control to enable or disable graph interaction.
- Use Reflow graph in the panel header to discard manual positions and recompute the layout.
The graph is a project-level view intended for exploration. For the underlying task and target model, see Graph concepts and Tasks.